Graduation & Retention Rates
Text Version
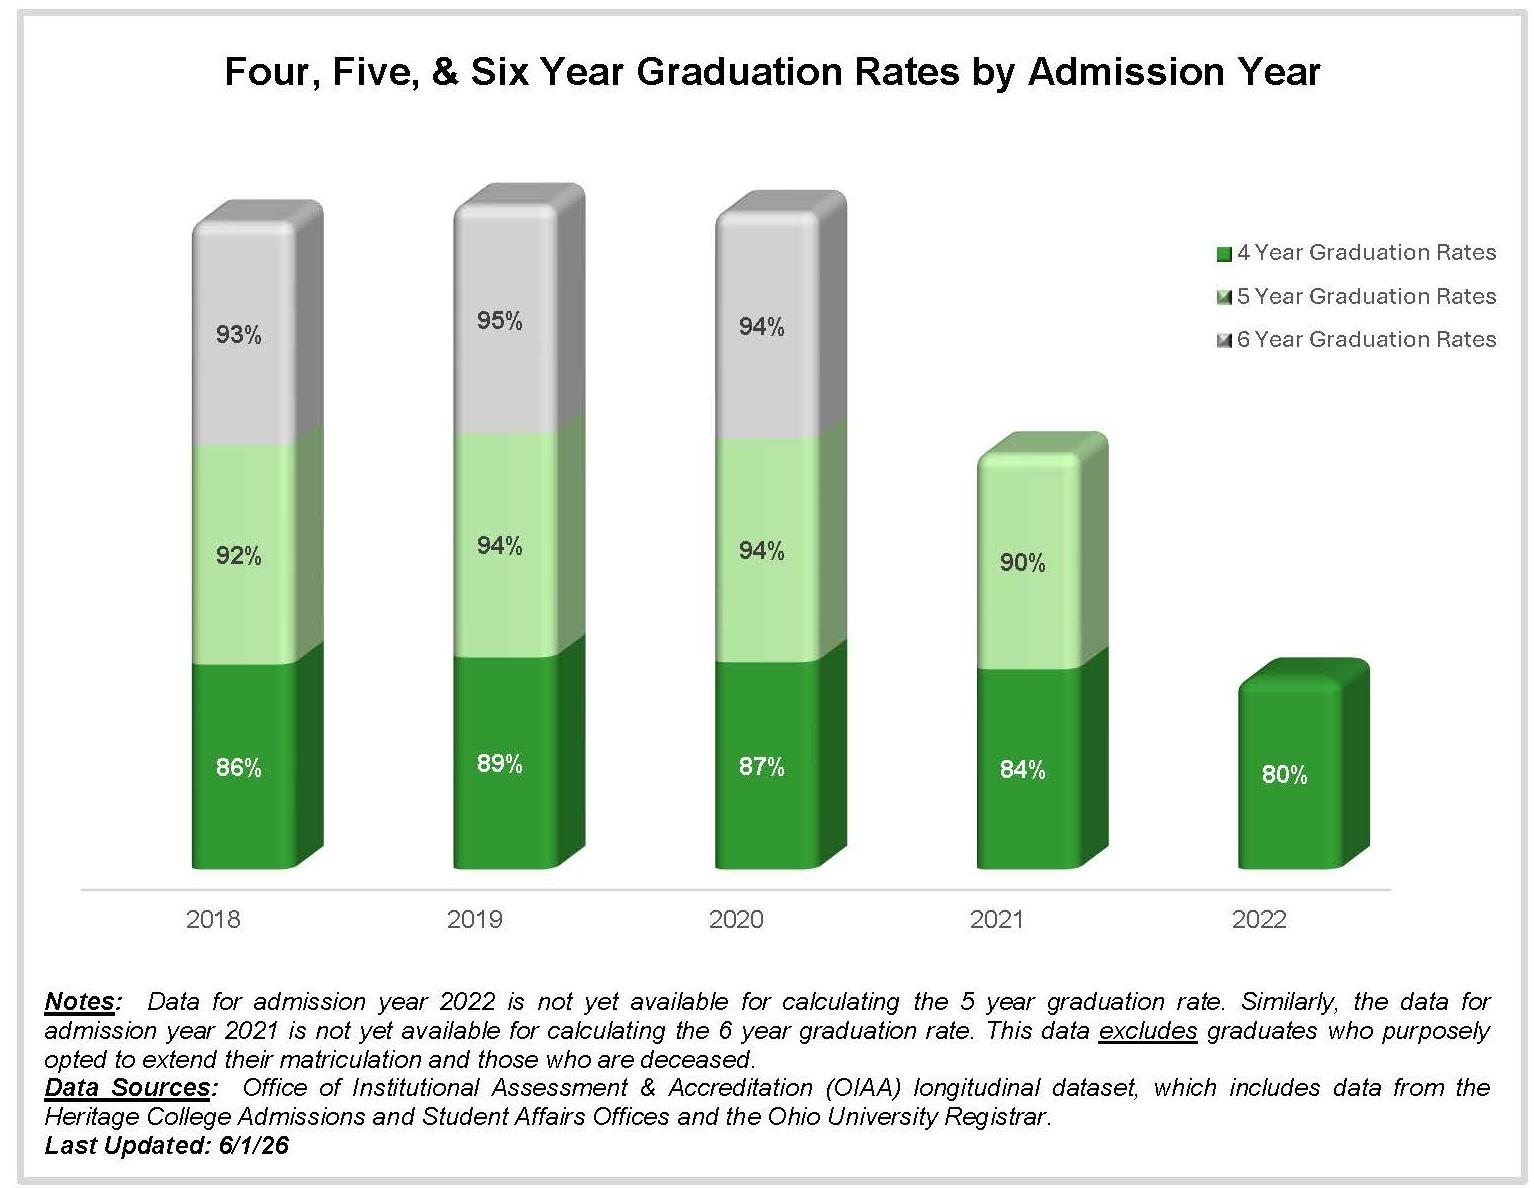
For the 2018 admission cohort, the four year graduation rate was 86%, the five year graduation rate was 92%, and the six year graduation rate was 93%.
For the 2019 admission cohort, the four year graduation rate was 89%, the five year graduation rate was 94%, and the six year graduation rate was 95%.
For the 2020 admission cohort, the four year graduation rate was 87%, the five year graduation rate was 94, and the six year graduation rate was 94%.
For the 2021 admission cohort, the four year graduation rate was 84% and the five year graduation rate was 90%.
Notes: Data for admission year 2022 is not yet available for calculating the 5 year graduation rate. Similarly, the data for admission year 2021 is not yet available for calculating the 6 year graduation rate. This data excludes graduates who purposely opted to extend their matriculation and those who are deceased.
Data Sources: Office of Institutional Assessment & Accreditation (OIAA) longitudinal dataset, which includes data from the Heritage College Admissions and Student Affairs Offices and the Ohio University Registrar.
Last Updated: 6/5/26