Generating Sponsored Projects (SP) Reports
Generating Sponsored Projects (SP) Reports
Sponsored Projects allows you to create, save and export Award and Proposal reports.
Please note:
- You will only be able to access data that you've been given permission to access. For questions about your account permissions, please contact your Administrator.
- Reports containing large data sets may take several minutes to load.
Accessing and Generating Reports
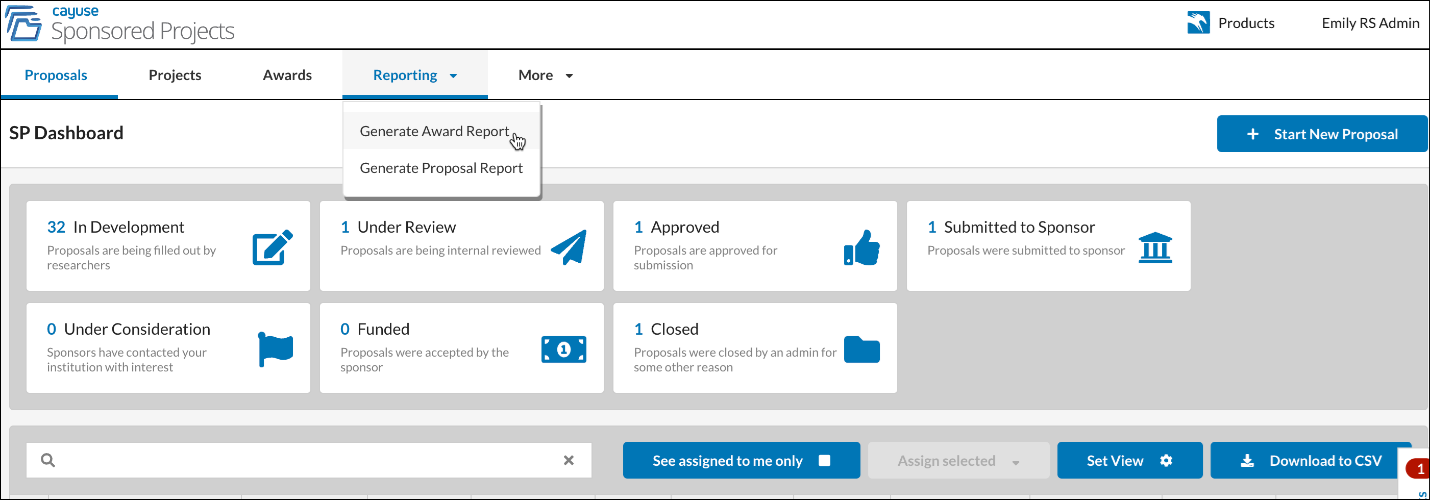
All users can access the Reporting tab from the SP home page.
Select the type of report you would like to generate - Award or Proposal. You will be taken to the report dashboard for the selected report.
Report Dashboard
When the report is generated, default fields will automatically populate with data available from the fields in your form and in your specific environment. In addition to the default fields, you can add more fields using the Fields functionality (discussed below). We will also be adding additional fields in the future.
Default Fields in Proposal Report
- Project Number
- Proposal Number
- Admin Unit
- Instrument Type
- Proposal Type
- Sponsor
- Prime Sponsor
- Project Start Date
- Project End Date
- Sponsor Deadline
- PI
- PI Unit
- Proposal Created Date
- Status
- Project Title
Default Fields in Award Report
- Project Number
- Award Number
- Admin Unit
- Instrument Type
- Award Type
- Sponsor
- Prime Sponsor
- Award Start Date
- Award End Date
- PI
- Total Expected Amount
- Obligated Amount
- Anticipated Amount
- Increment Amount
- Award Created Date
- Status
- Project Title
- Modification number
- Modification Type
- Modification Date
- Modified By
Default Report View
The default report view can be modified by accessing the following tools, located on the report dashboard:
- Sort
- Open
- Export
- Restore
- Fields
- Filter
- Save
- Grid
- Format
- Full Screen
Sort
Columns can be sorted in ascending or descending order.
- Hover your mouse over the column name (ex: Project End Date). An arrow will appear to the right of the column name.
- Click the arrow up or down arrow to sort in ascending or descending order.
Your sorted data will appear in the order selected.
Filter
Select specific data to view within columns.
- Click the small settings wheel located to the left of the column name.
- Check one or more boxes for the desired filters, then click Apply.
Your report will now display only results matching your filter.
Export
Please note: Reports containing large data sets may take several minutes to load.
Export your report data to various formats (print, HTML, CSV, Excel, Image, PDF) for saving or sharing.
- Hover your mouse over the Export button. Select the desired export format. The file will download to your device.
Save
Once you have modified your report, you will save it in the default .json file. The .json file will save your format only (not the data) to ensure your format is preserved for future use. The file will download to your device so that you can upload it in the future, using the Open feature discussed below.
- Click the Save Button.
- Click Save to confirm you would like to save the file.
The .json file will download to your device and can be used at a later time by utilizing the Open button (see below).
Open
Open your saved work, format, and layout using the previously downloaded .json file.
- Hover your mouse over the Open button and click Local report.
- Select the .json file you wish to open. Click on Open.
Your saved file will display.
Grid
Click on Grid to return to the original column view. The Grid button will be more useful once we add other views to the page in the future.
Restore
Click Restore to return to the default values and grid.
Format
Format cells or apply conditional formatting in specific columns.
Format Cells
- Hover your mouse over the Format button. Select Format Cells.
- Select the name of the column you want to format.
- Update the formatting. Click Apply.
The column will be displayed using the updated format settings.
Conditional Formatting
Conditional formatting allows you to change the appearance of cells on the basis of conditions that you specify.
- Hover your mouse over the Format button. Select Conditional Formatting.
- Click Add Condition
- Specify the conditions you want to apply. Click on Apply. To add more conditions, click on the plus sign.
The columns specified will update to display the selected conditional formatting.
Fields
Choose from all form objects that exist to select and arrange columns within your report.
- Click on the Fields button.
- You will see a comprehensive list of all form objects. Check any boxes that you want displayed in your report. Uncheck any boxes you wish to remove from your report. Click Apply.
- Drag the button to the right of the column name (the three lines) to the preferred location within the report. Click Apply.
Your rearranged and updated columns will now be displayed.
Full Screen
Click on Full Screen to enlarge your report to the full size of your screen.