Image

Dan Karney, Ph.D.
If the sun isn't shining and the wind isn't blowing, then ramp up the fossil-fuel power plant to fill the gap. But it's not that easy or efficient to run a power grid that way, said economist Daniel Karney, who recently won a U.S. EPA challenge to study the effects of "ramping."
"Think about your car," Karney said. "If you're cruising along at highway speed, your engine is running very efficiently. But if you're at a stop sign, it takes a lot of energy to reach that highway speed.
"Ramping isn't instantaneous, meaning it can take more than 12 hours to bring a natural gas system up to capacity," Karney added. "And ramping with fossil fuels can actually cause an increase in emission rates as the system warms up. When a power company is trying to comply with government regulations, heat rates and efficiency are very important," said Karney, an associate professor of economics in the College of Arts and Sciences at Ohio University who conducts research at the intersection of energy and environmental policy.
Karney and Khyati Malik, a Ph.D. student at Ohio State University, will use Power Sector Emissions Data from the EPA's Clean Air Markets Division to study the ramping behavior of fossil fuel-fired power plants and the subsequent impact on emissions and regulatory compliance. Malik is an Ohio University alumna, having earned an M.A. in Economics from the College of Arts and Sciences in 2018.
"Utility-scale power plants traditionally ramp generation up and down to balance grid-level electricity demand and supply, but the increased deployment of intermittent and distributed renewables may impact the need for ramping," Karney said. Therefore, the project’s first goal is to evaluate if and how Clean Air Markets Program Data can be used to determine the ramping behavior of fossil-fuel fired electricity generating units in support of EPA's regulatory compliance and program evaluation.
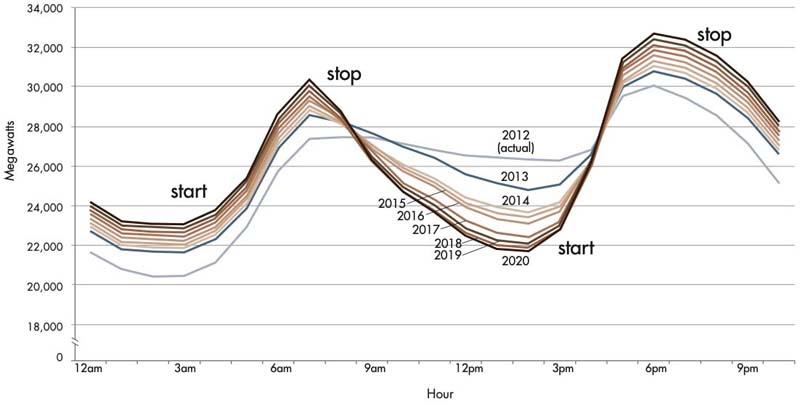
"We will also evaluate the potential effect of increased work-from-home employment during the pandemic on ramping and the 'Duck Curve' phenomenon," Karney said. "Ramping presents a particular challenge for electricity and associated emission markets in areas with large penetration of distributed solar capacity with a phenomenon known as the Duck Curve."
Californians are familiar with power grid fluctuations and brownouts, and now they are facing the Duck Curve, too.
"The daytime ‘belly’ or dipping of the curve occurs because of distributed solar generation (think roof top solar panels) reaching its apex in late mornings and early afternoons. Then, there is a period of transition when solar generation falls quickly with the dissipation of sunlight," Karney said. "During the drop in solar power generation, power plants then must step in and generate sufficient electricity to meet the demand; otherwise, the local grid becomes unstable, leading to brownouts. This steep increase in electricity generation is the ‘neck’ of the curve. The overall shape resembles a duck and hence provides the name."
He said power companies anticipate the need by ramping up generating capacity prior to the fall of the distributed solar power supply, but that can lead to excess generation before the grid reaches the neck. This timing is especially important as the neck can coincide with peak demand for energy-intensive activities like air conditioning.
Could the Duck Curve and brown outs be the next West Coast phenomenon to sweep east?
"With an increased distributed solar generation across the United States, there exists a possibility of the curve migrating outside of California," Karney said. "Solving this problem could require investment in energy storage and costly demand response programs in order to deal with the Duck Curve."
The second goal of the project is to analyze the effect of an exogenous shock like the COVID-19 pandemic on the curve by analyzing the changes in the overall energy consumption because of a surge in work from home, which is expected to continue past the pandemic.
"In the absence of work from home, the curve shows that the demand for electricity is highest when people prepare to go for work or school in the morning or after they have returned in the evening. Higher rates of work from home may lead to smoothening of the fluctuations in demand for electricity with households having a steady daytime electricity use. This implies that potentially less ramping is required in the transition period and would mitigate some need for energy storage and demand response," Karney said.
"However, work from home could theoretically exacerbate the curve's neck if demand sufficiently increased, and it is unclear if increased work from home exacerbates or lessens the effect of the curve and the subsequent expected future cost of mitigating the curve's effects on generation and emissions," he said.

That's why Karney and Malik will be modeling the size of the ramping effect on generation and emissions and its subsequent effect on switching from solar power generation to fossil-fuel based power generation. They will be using machine learning methods like artificial neural networks or random decision forests to identify the most efficient model.
"The use of machine learning methods to model the high-frequency electricity demand and emissions data provides a data-driven predictive model that utilizes various inputs from Clean Air Markets Program Data and other datasets. We will simulate various scenarios and evaluate the frequency and size of the ramping effects," said Malik, who has working papers in the field of public economics and is currently working on her Ph.D. dissertation in the fields of energy, environmental and regional economics.
"Using the machine learning tools, we hope to identify the ramping conditions that maximize the efficiency of electricity generation and minimize the emissions, all else equal," Karney said.
"To examine if higher rates of work from home led to smoothening of the fluctuations in the net demand for grid electricity, we will construct the curves before and after the pandemic and then compare them with a counterfactual curve assuming the absence of the pandemic shock using the machine learning model," said Karney, who previously worked at ICF International running the Integrated Planning Model in support of the EPA's Clean Air Markets Division regulatory analysis.
While Karney and Malik are working with U.S. data for their project, "The Effect of Thermal Electric Generator Ramping on Emissions, Regulatory Compliance, and the Duck Curve," Karney said their work could theoretically inform international markets as well.