
Student Outcomes
Student Outcomes
Retention and Graduation
Central to Ohio University’s mission and vision is student development and success. Retention, graduation, further education, employment, and licensure pass rates all provide indicators with regard to student achievement at Ohio University.
-
OHIO Outcomes DashboardThe OHIO Outcomes Dashboard provides the OHIO community with employment and further education outcomes for its graduates. This dashboard is updated annually.
-
Employers of Ohio University Alumni DashboardThe Employers of Ohio University Alumni Dashboard provides the OHIO community with the employers who most frequently employ our graduates. The employer names are self-reported by our alumni and the dashboard is updated annually.
Learn How to Communicate These Data Accurately
Complying with the Title IV Misrepresentation Rule
(https://www.ecfr.gov > title-34 > subtitle-B > chapter-VI)
How Can Institutions Avoid Violating the Misrepresentation Rule?
The following strategies can help institutions to mitigate their risk of misleading current or prospective students about the employability of program graduates:
- Substantiate all program-related claims (e.g., graduate placement rates, student testimonials) with evidence that can be easily produced in the event of legal action
- Follow established rules of statistical significance and available guidelines (e.g., NACE survey response rate guidelines) when conducting graduate surveys or other data collection efforts
- Ensure that all website material, marketing collateral, and other information remains up-to-date
- Do not include any information on marketing collateral, website pages, or other institutionally affiliated publications that you cannot definitively verify and defend
Source: EAB’s Tool 5: Misrepresentation Rule Briefing Sheet
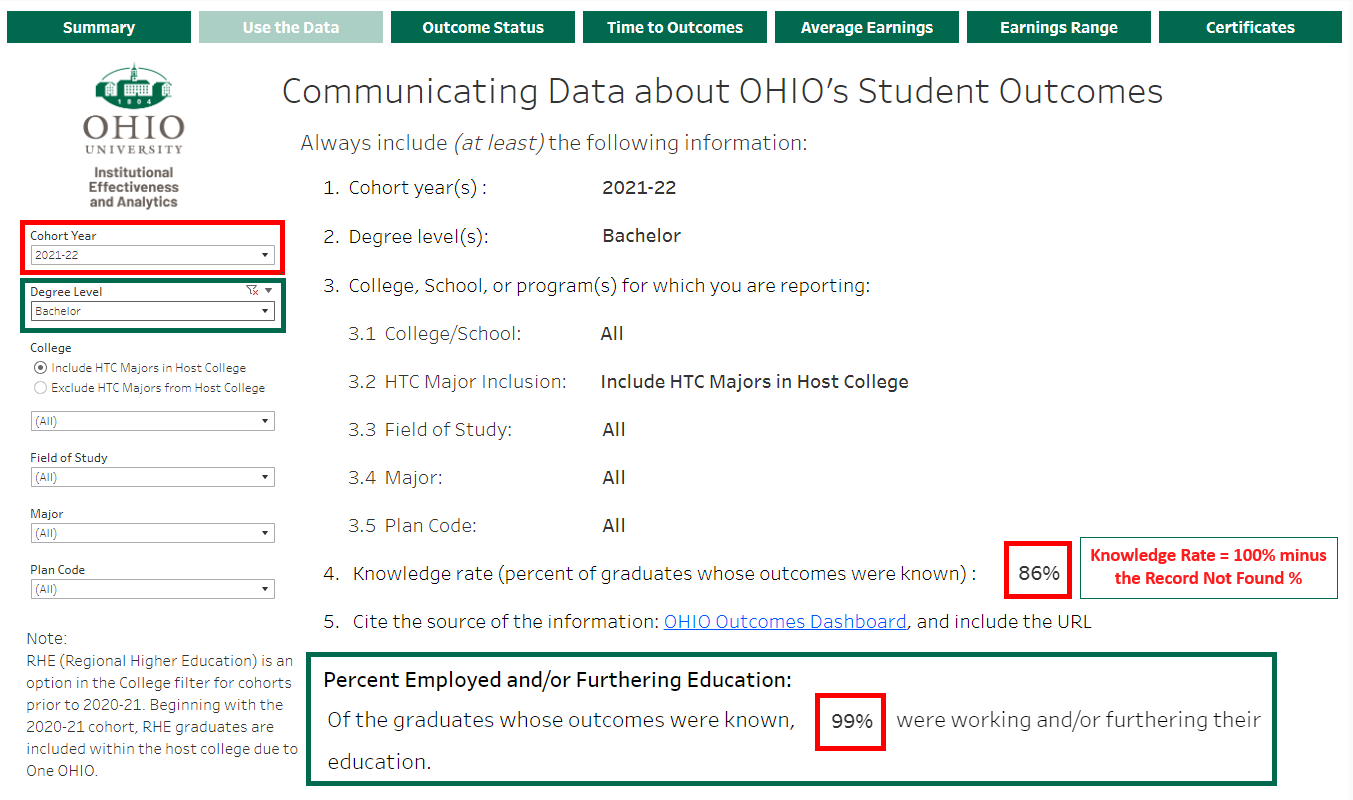
Communicating data about OHIO’s Student Outcomes:
Always include (at least) the following information:
- Cohort year(s)
- Degree level(s)
- College, School, or program(s) for which you are reporting
- Knowledge Rate, using the phrase “…of graduates whose outcomes were known…”
- Cite the source of the information, i.e., OHIO Outcomes Dashboard (link)
Please reach out to IEA if you have any questions or need clarification on available data.
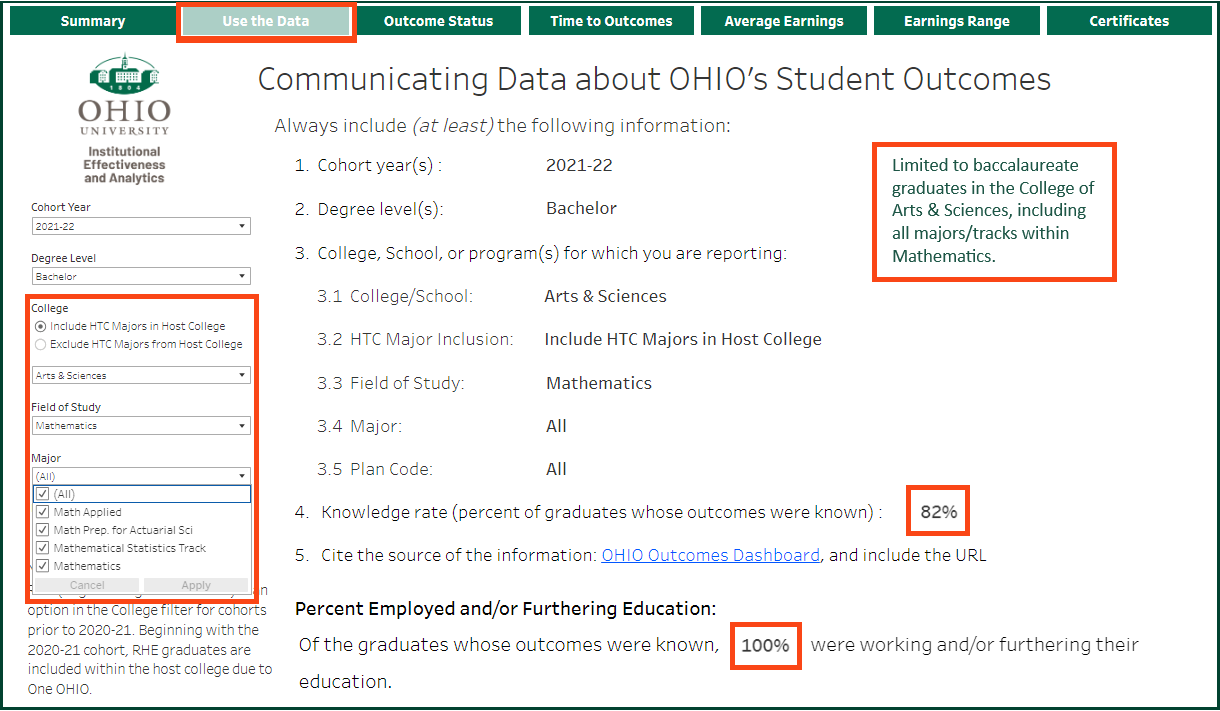
Example 1:
One hundred percent (100%) of the 2021-22 bachelor's degree graduates in Mathematics, including Actuarial Science, Applied Mathematics, Mathematical Statistics, whose outcomes were known were either employed, in school, or both. The knowledge rate for this cohort was 82%.
OR
100% of Mathematics graduates whose outcomes are known were either employed or in school or both (2021-22 baccalaureate completers, 82% knowledge rate). OHIO Outcomes Dashboard (link)
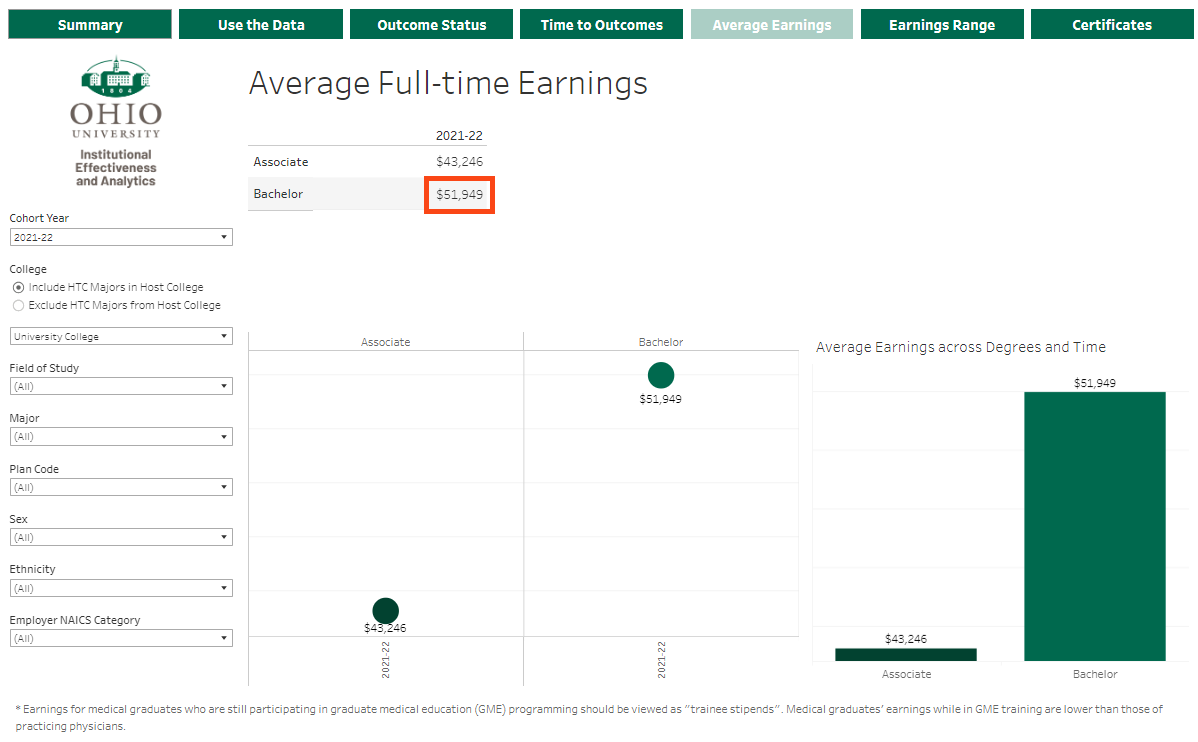
Example 2:
The average full-time earnings for University College baccalaureate graduates from the 2021-22 cohort was $51,949. Notes: 84% knowledge rate OHIO Outcomes Dashboard (link)
Questions OHIO Outcomes Dashboard Can Answer:
- What proportion of OHIO graduates are employed one year after graduating and how long did it take them to be employed? What is their average annual wage and what are the trends?
- What proportion of OHIO graduates pursue further education and how soon after graduating?
- How does employment and further education outcomes for OHIO graduates vary by degree level, college, field of study, major, or any combination of the above?
OHIO Outcomes Dashboard Can be Used to Support:
- Students’ career and academic advisement
- Evidence for accreditation and program reviews
- Recruitment of and marketing to new students
Sources of Outcomes Data:
- Ohio Department of Jobs and Family Services (ODJFS): provided employment data for graduates through a matching of records between OHIO and ODJFS Unemployment Insurance (UI) system. It is important to note that matched data only tracks employment in Ohio. It excludes federal employees and self-employed.
- Career and Further Education (CAFE) Survey: provided supplemental employment data on graduates’ whose records were not found in the ODJFS match.
- National Student Clearinghouse (NSC): provided further education data through a match of records with NSC that provides national post-secondary enrollment and completion data.
- OHIO’s Graduation Application Survey: provided further employment and education data, self-reported in the student’s last semester prior to graduation from OHIO.
US Census Bureau's Post-Secondary Employment Outcomes
-
Comparative Graduate Earnings - Ohio Public InstitutionsThis dashboard uses the most recent cohorts from the US Census Bureau's Postsecondary Education Outcomes dataset to compare all public institutions in the state of Ohio on graduate earnings at one-year, five-year and ten-year post-graduation.
-
PSEO ExplorerPost-Secondary Employment Outcomes (PSEO) Explorer is a visualization tool on the earnings and employment outcomes of graduates of select post-secondary institutions in the United States, including graduates from the state of Ohio.
Post-Secondary Employment Outcomes (PSEO) Exlporer tool provides summary employment earnings at the 25th, 50th, and 75th percentiles, one, five, and 10 years after graduation, by institution, degree level, degree field, and graduation cohort. Employment Flows tabulations provide the destination industry and geography of employment for graduates of an institution also by degree level, degree field, and graduation cohort, for one, five, and 10 years after graduation. Graduation cohorts include groups of three academic years, with the most recent one-year outcomes currently available for students graduating between 2016 and 2018, five-year outcomes available for students graduating between 2010-2012 and ten-year outcomes for those graduating from 2007-2009.
The U.S. Census Bureau uses the Longitudinal Employer-Household Dynamics (LEHD) database of jobs covering over 96% of employment in the United States to generate the post-graduation outcomes reported in the PSEO Explorer. The core jobs data are state unemployment insurance (UI) wage records collected via a voluntary federal-state data sharing partnership. These job records are then supplemented with the U.S. Census Bureau surveys and other federal agency administrative records to supply additional information on the characteristics of the workers.
PSEO earnings are total annual earnings for workers from all jobs, converted to 2020 dollars using the CPI-U. Graduates who earn at least the annual equivalent of full-time work, at the prevailing federal minimum wage, and work three or more quarters in a calendar year are included. For more information about the PSEO Explorer’s methodology, data sources, and population and employment coverage, please see the PSEO Explorer’s documentation page.
Board and Licensure Pass Rates
Patton College of Education
Heritage College of Osteopathic Medicine
College of Health Sciences and Professions
| CHSP School of Nursing Pass Rates | Archived Pass Rates |
|---|---|
| ADS Annual NCLEX-RN pass rates (According to OBN calculations) | Pass Rates 2017 through 2023 |
| NCLEX-RN pass rates for all location and modalities BSN | Pass Rates 2014 through 2023 |
| Graduate Program Certification Rates | Pass Rates 2014 through 2023 |
| CHSP Department of Athletic Training | Pass Rates |
|---|---|
| Master of Athletic Training-Professional | BOC Pass Rates 2020-21 through 2023-24 |
| CHSP School of Rehabilitation and Communication Sciences Pass Rates | Pass Rates |
|---|---|
| Physician Assistant Practice | PANCE Pass Rates 2017 through 2023-24 |
| CHSP Department of Hearing, Speech and Language Sciences Pass Rates | Pass Rates |
|---|---|
| AuD and MS-SLP | PRAXIS Exam Pass Rates 2019-20 through 2023-24 |
| CHSP Department of Physical Therapy Pass Rates | Pass Rates |
|---|---|
| Physical Therapy | NPTE Pass Rates 2008-2023-24 |
CHSP Pass Rates by Year:
| Department | Exam | 2014 | 2015 | 2016 | 2017 | 2018 | 2019 | 2020 | 2021 | 2022 | 2023 | 2024 |
|---|---|---|---|---|---|---|---|---|---|---|---|---|
| Social and Public Health | Child and Family Studies Pass Rates for Certified Child Life Specialist Exam | 100% | 100% | 100% | 100% | 100% | 100% | 100% | 100% | 100% | 100% | 100% |
| Interdisciplinary Health Studies | Medical Assisting Technology program certification (this program was discontinued and is no longer offered) | -- | 80% | 100% | 100% | 100% | 75% | -- | 100% | 100% | 100% | |
| Food and Nutrition Sciences | RD/RDN (Registered Dietician/ Registered Dietitian Nutritionist) pass rates within one year of first attempt (5 year average is 96%) | -- | -- | 100% | 100% | 100% | 84.21% | 100% | 91% | 100% | 90% | 100% |
| Social Work | Bachelors | 77% | ||||||||||
| Masters | 74.4% |
Other Required Disclosures:
If you need accessibility accommodations to view this data, please contact our department at 740-593-1059.